
Mapped: The World’s Ultra-Rich, by Country
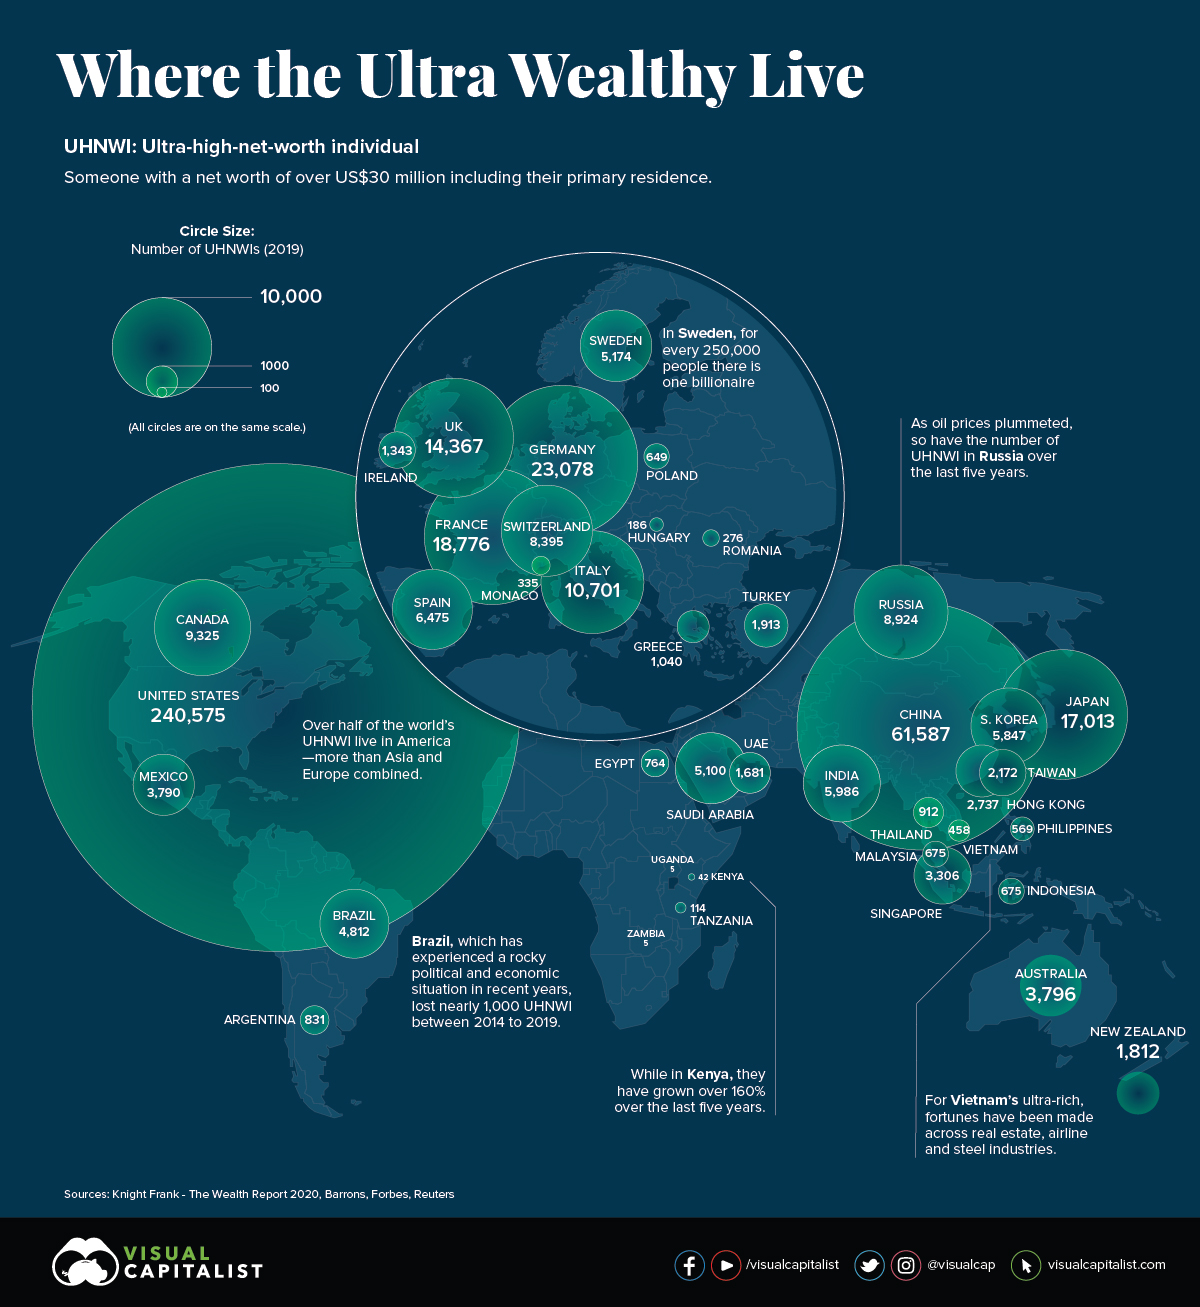
The global number of ultra-high net-worth individuals (UHNWIs) — those with over $30 million in assets — has continued to rise over the years.
Today’s infographic draws data from Knight Frank’s 2020 Wealth Report released in March, and it shows which countries have the highest number of UHNWIs, as well as how that number is projected to change in years to come.
No Ordinary Millionaire
To start, let’s look at where the world’s wealthiest could be found in 2019, which is both the peak of the decade-long bull market and the most recent year of data covered by the report.
| Rank | Country | Ultra-High Net Worth Population | 1-Year Change (%) |
|---|---|---|---|
| #1 |  United States United States |
240,575 | 5.9% |
| #2 |  China China |
61,587 | 14.7% |
| #3 |  Germany Germany |
23,078 | 0.8% |
| #4 |  France France |
18,776 | 7.9% |
| #5 |  Japan Japan |
17,013 | 17.0% |
| #6 |  UK UK |
14,367 | 3.6% |
| #7 |  Italy Italy |
10,701 | 20.8% |
| #8 |  Canada Canada |
9,325 | 5.3% |
| #9 |  Russia Russia |
8,924 | 3.9% |
| #10 |  Switzerland Switzerland |
8,395 | 3.0% |
| #11 |  Spain Spain |
6,475 | -1.1% |
| #12 |  India India |
5,986 | 0.2% |
| #13 |  South Korea South Korea |
5,847 | 21.6% |
| #14 |  Sweden Sweden |
5,174 | 0.3% |
| #15 |  Saudi Arabia Saudi Arabia |
5,100 | 0.0% |
While the U.S. maintained its foothold, the ultra-rich in South Korea and Italy have grown over 20% each since 2018. An economic model focused on exports, conglomerates, and select manufacturing industries could likely be behind the UHNWI boom in South Korea.
Interestingly, the number of ultra-wealthy in Saudi Arabia increased by only one individual between 2018 and 2019.
Multi-Millionaire Next Door
Taking a closer look, what made up the wealth of this ultra rich population? Knight Frank found that 27% of UHNWI wealth was locked up in property investments:
| Property as an Investment | Equities | Bonds/Fixed Income | Cash | Private Equity | Collectables | Gold/Precious Metals | Crypto |
|---|---|---|---|---|---|---|---|
| 27% | 23% | 17% | 11% | 8% | 5% | 3% | 1% |
In terms of more liquid assets, the average UHNWI held 23% of their wealth in equities, 17% in bonds, 11% in cash, and 3% in precious metals. It will be illuminating to see how, or if, this changes in the aftermath of the ongoing COVID-19 economic crisis.
The Future Destination Hubs
Fast-forward to 2024, and Knight Frank estimates that the global hotspots of the world’s wealthiest will remain consistent, with some notable winners over the decade.
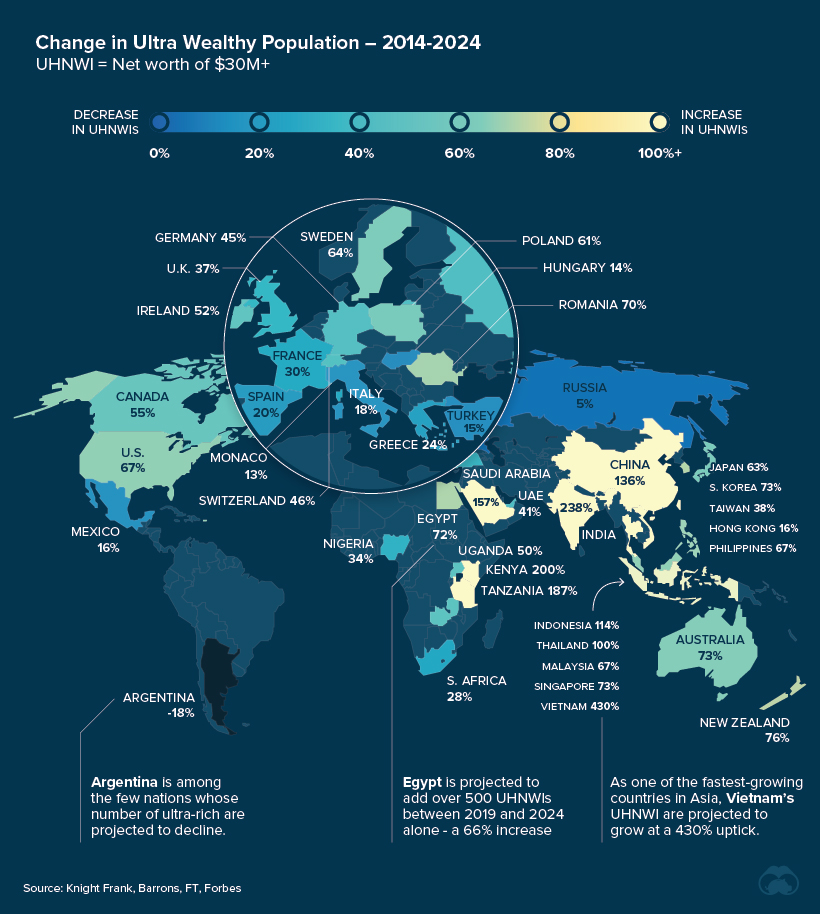
The greatest difference will be the rising cohort of the ultra-wealthy in China and India, both projected to grow by triple digits between 2014 and 2024. This burgeoning middle class in China is driving domestic consumption and is transforming the consumer landscape.
| Rank | Country | UHNWIs (Projected, 2024) | 10-Year Change (Projected, %) |
|---|---|---|---|
| #1 | U.S. |
293,136 | 67.0% |
| #2 | China |
97,082 | 135.8% |
| #3 | Germany |
26,819 | 45.0% |
| #4 | France |
22,728 | 29.7% |
| #5 | Japan |
19,110 | 63.3% |
| #6 | UK |
18,818 | 36.7% |
| #7 | Italy |
12,508 | 17.6% |
| #8 | Canada |
11,928 | 54.8% |
| #9 | Russia |
11,019 | 4.8% |
| #10 | India |
10,354 | 238.3% |
As the ripple effects of COVID-19 continue to take hold, experts pose differing opinions on how its impacts on the global economy will unfold.
Could the crash hasten the number of ultra-rich as inequality is laid bare, or will wealth be redistributed in response to the unprecedented crisis?

Get your mind blown on a daily basis:
The post Mapped: The World’s Ultra-Rich, by Country appeared first on Visual Capitalist.
Originally posted here: https://www.visualcapitalist.com/map-worlds-ultra-rich-by-country/
